National Weather Service data · Beach safety
America's Most Dangerous Beaches (2026)
The National Weather Service recorded 1,239 surf-zone deaths in the US and its territories from 2010 to 2025: people killed by rip currents, high surf and other wave hazards at the beach. We grouped every one by beach, state, cause, month and age to show where the water is most dangerous, and when.
By Laurence Tuchin, Founder, SurfSpotGuide
927 of 1,239 surf-zone deaths were rip currents (National Weather Service, preliminary).
- surf-zone deaths recorded by the NWS, 2010–2025
- 1,239
- deaths at Panama City Beach, Florida, the most of any beach area
- 45
- as many rip current deaths as shark deaths on US ocean coasts
- 44×
Key takeaways
- 01Florida recorded the most surf-zone deaths of any US state or territory from 2010 to 2025: 320 of 1,239, according to SurfSpotGuide analysis of preliminary National Weather Service data.
- 02Rip currents caused 927 of the 1,239 surf-zone deaths recorded in the US from 2010 to 2025 (75%), according to SurfSpotGuide analysis of preliminary National Weather Service data.
- 03Panama City Beach, Florida, recorded more surf-zone deaths than any other US beach area from 2010 to 2025: 45, 42 of them in rip currents, according to SurfSpotGuide analysis of preliminary National Weather Service data.
- 042021 was the deadliest year in the US surf zone from 2010 to 2025, with 129 deaths, according to SurfSpotGuide analysis of preliminary National Weather Service data.
- 05Men made up 86% of US surf-zone deaths from 2010 to 2025 where gender was recorded (1,058 of 1,229), according to SurfSpotGuide analysis of preliminary National Weather Service data.
- 06Rip currents killed 44 times as many people as sharks on US ocean coasts from 2010 to 2025: 667 rip current deaths in the 50 states against 15 fatal unprovoked shark bites, according to SurfSpotGuide analysis of National Weather Service and International Shark Attack File data.
- 0787 people died in the US surf zone from 2010 to 2025 while trying to rescue someone else, according to SurfSpotGuide analysis of preliminary National Weather Service data.
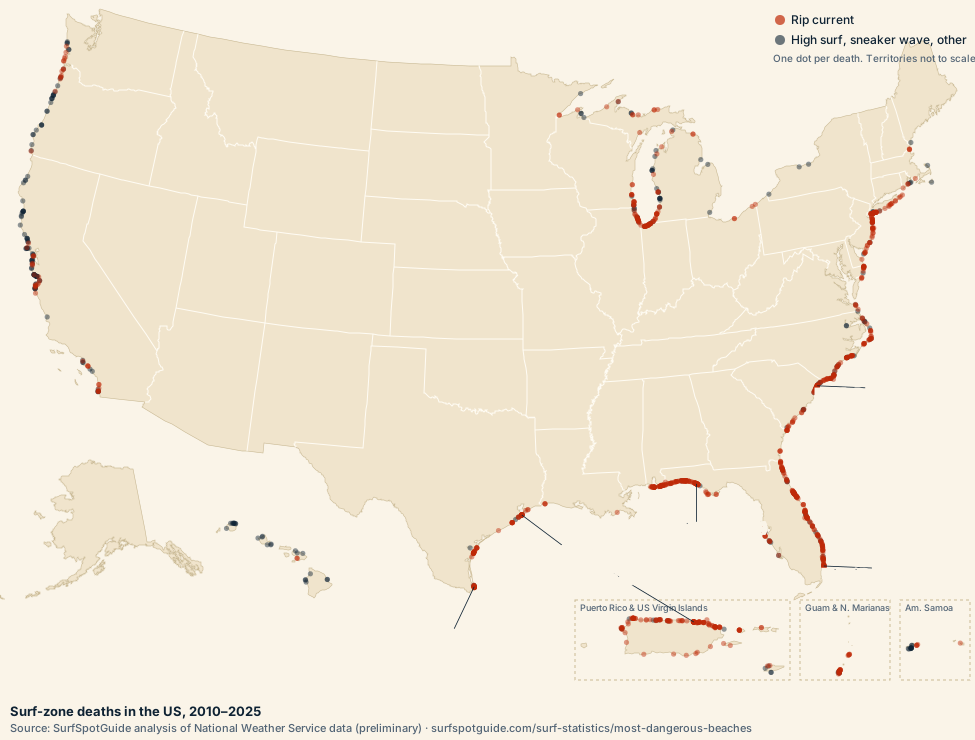
What is the most dangerous beach in the US?
Panama City Beach, Florida, recorded the most surf-zone deaths of any US beach area from 2010 to 2025: 45, 42 of them in rip currents, along 21.4 km of beach. The 20 beach areas with the most deaths are below.
| # | Beach area | Deaths | Rip current | Length (km) | Years |
|---|---|---|---|---|---|
| 1 | Panama City Beach, FloridaAlso listed as: Panama City; 1 Ese Sunnyside; Near M.b. Miller County Pier | 45 | 42 | 21.4 | 2012–2025 |
| 2 | Condado Beach (La Concha), San Juan, Puerto RicoAlso listed as: Condado Beach; Condado; Condado Beach Near La Concha Hotel | 22 | 22 | 3.3 | 2014–2024 |
| 3 | South Padre Island, TexasAlso listed as: Public Beach Access Point #2 On South Padre Island; Isla Blanca Park South Padre Island; Andy Bowie Park | 21 | 18 | 11.2 | 2010–2025 |
| =4 | Galveston, TexasAlso listed as: Galveston Beach; Galveston Island; Pleasue Pier | 17 | 15 | 6.3 | 2011–2025 |
| =4 | Myrtle Beach, South CarolinaAlso listed as: Myrtle Beach Near 9th St | 17 | 14 | 6.2 | 2011–2024 |
| 6 | Miami Beach, FloridaAlso listed as: Allison Park Near 64th Street And Collins Avenue; Miamai Beach; 62nd And 63rd Streets On Miami Beach | 14 | 12 | 11.1 | 2010–2025 |
| 7 | Fort Morgan, AlabamaAlso listed as: Near Fort Morgan; 5 E Fort Morgan | 13 | 12 | 2.2 | 2013–2023 |
| =8 | Orange Beach, AlabamaAlso listed as: Near Cotton Bayou Beach; Baldwin County; Lower Baldwin County | 12 | 12 | 4.7 | 2010–2022 |
| =8 | Bob Hall Pier and Packery Channel, Corpus Christi, TexasAlso listed as: Padre Island; Bob Hall Pier; Near Bob Hall Pier | 12 | 12 | 4.5 | 2010–2021 |
| =8 | Jobos Beach, Isabela, Puerto RicoAlso listed as: Montones Beach; Jobos Beach, Isabela; Playa Montones | 12 | 12 | 1.3 | 2014–2025 |
| =8 | Isla Verde (Balneario de Carolina), Carolina, Puerto RicoAlso listed as: La Pocita; Isla Verde; Piñones/loiza | 12 | 11 | 5.6 | 2013–2025 |
| =12 | La Pared Beach, Luquillo, Puerto RicoAlso listed as: La Boca Beach, Luquillo; Public Beach La Monserrate In Luquillo; Luquillo | 10 | 10 | 2.5 | 2014–2024 |
| =12 | Melbourne Beach and Indialantic, FloridaAlso listed as: Spessard Holland Beach; Indialantic; Melbourne Beach, Fl | 10 | 10 | 5.3 | 2015–2023 |
| =12 | Miramar Beach, FloridaAlso listed as: South Walton County 700 Block Of Scenic Gulf Drive; Miramar Beach, Fl; Miramar | 10 | 10 | 1.2 | 2016–2023 |
| =12 | New Smyrna Beach, FloridaAlso listed as: Ormond Beach; New Smyrna | 10 | 9 | 4.4 | 2010–2022 |
| =12 | Daytona Beach, FloridaAlso listed as: Daytona Beach Shores; Daytona Beach Pier; Near Daytona Beach Bandshell | 10 | 9 | 4 | 2018–2025 |
| =12 | Poza de las Mujeres, Manatí, Puerto RicoAlso listed as: Poza De Las Mujeres; Poza Las Mujeres In Manati; Poza Las Mujeres Beach | 10 | 8 | 5.8 | 2010–2025 |
| =12 | Emerald Isle, North Carolina | 10 | 7 | 3.9 | 2017–2020 |
| =12 | Tumon Bay, Tamuning, GuamAlso listed as: Jonestown Overlook In Tamuning; Nikko Hotel Beach; Tomon Beach | 10 | 4 | 1.9 | 2011–2025 |
| 20 | Fort Lauderdale, FloridaAlso listed as: Coastal Broward County; Ft Lauderdale Beach; Fort Lauderdale Beach | 9 | 8 | 7.5 | 2010–2025 |
Source: SurfSpotGuide analysis of preliminary National Weather Service surf-zone fatality data, 2010–2025. A beach area is every death within 2 km of another along the same coast; length is the distance between its furthest two.
Which state has the most rip current deaths?
Florida recorded the most surf-zone deaths of any US state or territory from 2010 to 2025, 320, of which 283 were rip currents. Puerto Rico (138) and California (105) follow.
- Florida320
- Puerto Rico138
- California105
- North Carolina94
- Texas77
- South Carolina55
- Michigan55
- New York45
- Alabama45
- New Jersey43
Show the numbers
| # | State or territory | Deaths 2010–2025 | Rip current | High surf | Deaths 2025 |
|---|---|---|---|---|---|
| 1 | Florida | 320 | 283 | 16 | 21 |
| 2 | Puerto Rico(territory) | 138 | 128 | 10 | 11 |
| 3 | California | 105 | 30 | 47 | 11 |
| 4 | North Carolina | 94 | 72 | 6 | 5 |
| 5 | Texas | 77 | 69 | 3 | 8 |
| =6 | South Carolina | 55 | 41 | 0 | 6 |
| =6 | Michigan(Great Lakes) | 55 | 32 | 1 | 2 |
| =8 | New York | 45 | 36 | 0 | 2 |
| =8 | Alabama | 45 | 43 | 1 | 1 |
| 10 | New Jersey | 43 | 40 | 2 | 3 |
| 11 | Guam(territory) | 36 | 22 | 14 | 1 |
| 12 | Oregon | 34 | 9 | 14 | 3 |
| =13 | Indiana(Great Lakes) | 27 | 23 | 0 | 0 |
| =13 | Illinois(Great Lakes) | 27 | 19 | 1 | 4 |
| 15 | Hawaii | 26 | 2 | 19 | 10 |
| 16 | Wisconsin(Great Lakes) | 23 | 17 | 3 | 2 |
| 17 | Maryland | 13 | 11 | 0 | 1 |
| 18 | American Samoa(territory) | 12 | 3 | 9 | 2 |
| =19 | Virginia | 9 | 7 | 0 | 2 |
| =19 | Washington | 9 | 6 | 1 | 2 |
| 21 | US Virgin Islands(territory) | 8 | 4 | 3 | 0 |
| =22 | Rhode Island | 6 | 3 | 2 | 0 |
| =22 | Georgia | 6 | 6 | 0 | 0 |
| =24 | Northern Mariana Islands(territory) | 4 | 4 | 0 | 0 |
| =24 | Louisiana | 4 | 4 | 0 | 0 |
| =24 | Ohio(Great Lakes) | 4 | 4 | 0 | 2 |
| =27 | Massachusetts | 3 | 1 | 2 | 0 |
| =27 | Minnesota(Great Lakes) | 3 | 2 | 1 | 1 |
| =27 | New Hampshire | 3 | 3 | 0 | 1 |
| =30 | Maine | 1 | 0 | 1 | 0 |
| =30 | Delaware | 1 | 1 | 0 | 0 |
Source: SurfSpotGuide analysis of preliminary National Weather Service data, 2010–2025. Download as CSV.
What are the most dangerous beaches in Florida?
Panama City Beach, Florida, had the most: 45 surf-zone deaths from 2010 to 2025. Florida recorded 320 in all, 283 of them in rip currents.
| # | Beach area | Deaths | Rip current | Years |
|---|---|---|---|---|
| 1 | Panama City Beach | 45 | 42 | 2012–2025 |
| 2 | Miami Beach | 14 | 12 | 2010–2025 |
| =3 | Melbourne Beach and Indialantic | 10 | 10 | 2015–2023 |
| =3 | Miramar Beach | 10 | 10 | 2016–2023 |
| =3 | New Smyrna Beach | 10 | 9 | 2010–2022 |
What are the most dangerous beaches in California?
Bonny Doon Beach, California, had the most: 8 surf-zone deaths from 2010 to 2025. California recorded 105 in all, 30 of them in rip currents.
| # | Beach area | Deaths | Rip current | Years |
|---|---|---|---|---|
| 1 | Bonny Doon Beach | 8 | 1 | 2013–2021 |
| =2 | Ocean Beach | 6 | 3 | 2017–2020 |
| =2 | Sea Rocks | 6 | 0 | 2010–2025 |
| =4 | Monastery Beach | 4 | 1 | 2010–2019 |
| =4 | Ten Mile Beach | 4 | 0 | 2010–2010 |
How many people die from rip currents each year?
Rip currents killed 927 people in the US surf zone from 2010 to 2025, an average of 58 a year, and 75% of all surf-zone deaths. 2021 was the deadliest year, with 129 surf-zone deaths.
Deaths
2025: the NWS has not yet classified the hazard for 33 of 101 deaths, so its rip current count is likely to rise.
Show the numbers
| Year | All surf-zone deaths | Rip current |
|---|---|---|
| 2010 | 65 | 48 |
| 2011 | 41 | 30 |
| 2012 | 44 | 38 |
| 2013 | 73 | 53 |
| 2014 | 62 | 47 |
| 2015 | 62 | 48 |
| 2016 | 73 | 51 |
| 2017 | 75 | 64 |
| 2018 | 84 | 63 |
| 2019 | 98 | 60 |
| 2020 | 95 | 75 |
| 2021 | 129 | 97 |
| 2022 | 83 | 63 |
| 2023 | 90 | 83 |
| 2024 | 64 | 60 |
| 2025 | 101 | 47 |
Source: National Weather Service, 2010–2025. 2026 so far: 56 deaths to September 17, 2026 (preliminary, not in the totals above).
When do most rip current deaths happen?
June is the deadliest month in the US surf zone, with 195 deaths from 2010 to 2025; June to August together account for 44%. Sunday is the deadliest day of the week (276 deaths), against 134 on Thursdays.
- Monday137
- Tuesday147
- Wednesday154
- Thursday134
- Friday163
- Saturday228
- Sunday276
Show the numbers
| Month | Deaths |
|---|---|
| January | 73 |
| February | 35 |
| March | 85 |
| April | 80 |
| May | 146 |
| June | 195 |
| July | 188 |
| August | 162 |
| September | 117 |
| October | 71 |
| November | 46 |
| December | 41 |
| Day | Deaths |
|---|---|
| Monday | 137 |
| Tuesday | 147 |
| Wednesday | 154 |
| Thursday | 134 |
| Friday | 163 |
| Saturday | 228 |
| Sunday | 276 |
Source: SurfSpotGuide analysis of preliminary National Weather Service data, 2010–2025.
Who dies in rip currents?
Mostly men: 86% of US surf-zone deaths from 2010 to 2025 where gender was recorded (1,058 of 1,229). The median age was 34, and 87 of the people who died were trying to rescue someone else.
- Under 18216
- 18–24206
- 25–34149
- 35–44151
- 45–54156
- 55–64130
- 65 and over106
Age recorded for 1,114 of 1,239 deaths.
Show the numbers
| Age | Deaths |
|---|---|
| Under 18 | 216 |
| 18–24 | 206 |
| 25–34 | 149 |
| 35–44 | 151 |
| 45–54 | 156 |
| 55–64 | 130 |
| 65 and over | 106 |
The NWS recorded a hometown for 345 of the 1,239 people who died. Of those, 192 (56%) lived outside the state or territory where they died. Hometowns are more often noted for visitors, so this share can't be applied to all deaths.
Source: SurfSpotGuide analysis of preliminary National Weather Service data, 2010–2025.
Are rip currents more dangerous than sharks?
Far more. From 2010 to 2025, rip currents killed 667 people on the ocean coasts of the 50 states, against 15 deaths from unprovoked shark bites: about 44 rip current deaths for every shark death.
Sharks bit people 663 times in the 50 states over the same 16 years, without provocation, by the International Shark Attack File's count. The rip current figure leaves out the Great Lakes, where there are no sharks, and the territories, so both numbers cover the same coastline.
Sources: National Weather Service surf-zone fatality data (preliminary); International Shark Attack File, Florida Museum of Natural History, yearly worldwide summaries 2010 to 2025.
Do rip currents kill people on the Great Lakes?
Yes. 139 of the 1,239 US surf-zone deaths from 2010 to 2025 happened on Great Lakes beaches, in Michigan (55), Indiana (27), Illinois (27), Wisconsin (23), Ohio (4) and Minnesota (3).
Do hurricanes cause rip current deaths?
The NWS linked 99 of the 1,239 surf-zone deaths from 2010 to 2025 to a tropical storm or hurricane, often one far offshore: distant storms send long-period swell and rip currents to beaches under clear skies.
Most deaths linked to one storm: Tropical Storm Colin (6); Hurricane Lorenzo (distant) (6); Hurricane Larry (distant) (5); Hurricane Erin (distant) (5); Hurricane Earl (4).
Definitions
- Surf-zone death
- A death the National Weather Service attributes to a surf-zone hazard: a rip current, high surf, a sneaker wave or another current near the shore.
- Rip current
- A narrow, fast channel of water flowing away from the beach. It pulls swimmers out, not under.
- Beach area
- Every death within 2 km of another death on the same state's coast, named by the location the NWS used most often. Areas with fewer than 4 deaths are not listed.
- State or territory
- Where the death happened, not where the person lived. Includes Puerto Rico, Guam, American Samoa, US Virgin Islands, Northern Mariana Islands.
Methodology
We used the National Weather Service's incident file of surf-zone deaths, the data behind its surf fatalities dashboard: one row per death with its date, location, coordinates, hazard, age and gender. The NWS calls these figures preliminary, and they may not match other sources such as state health departments or the US Lifesaving Association.
Totals cover full calendar years 2010–2025. 2026 is reported separately, to September 17, 2026. Deaths are counted as the NWS lists them; where several rows are identical, we kept each one, as they are usually several people lost in one incident.
Locations are written by hand and vary ("Panama City Beach", "15000 block of Front Beach Road"), so we grouped deaths by their coordinates instead: any death within 2 km of another on the same coast joins its beach area. That keeps a long resort strip together while keeping the next town apart. A longer stretch of beach can record more deaths simply because it is longer, so the table gives each area's length. These are counts, not rates: we don't know how many people swim at each beach, so a high count can reflect a crowded beach as much as a dangerous one.
Sources
- NOAA National Weather Service, Surf Zone Fatalities: incident-level data, 2010 to present, from NWS Storm Data
- International Shark Attack File, Florida Museum of Natural History: unprovoked bites and deaths in the US, from each year's worldwide summary
Frequently asked questions
How do you escape a rip current?
The National Weather Service advises: stay calm and float to conserve energy. Swim parallel to the shore until you are out of the current, then swim back at an angle. If you can't, face the shore, wave and call for help. Swim near a lifeguard.
How often is this data updated?
Once a year, after the National Weather Service adds the latest full year. The date at the top of the page shows the last update.
Can I get the data for my state or beach?
Yes. Download the CSVs below, or email us for a local breakdown.
Learning to read the water is the best protection: find a surf school near you. Full data: beach areas (CSV).
Use this data
Free to use with a credit
Need your state's numbers, a beach-by-beach list or a quote? Email Laurence Tuchin, Founder: laurence@surfspotguide.com.
Suggested citation
SurfSpotGuide (2026). America's Most Dangerous Beaches (2026). https://www.surfspotguide.com/surf-statistics/most-dangerous-beaches
Download the full data (CSV)